Massive Analysis of cDNA Ends = highly sensitive 3′ mRNA-Seq
High Resolution Gene Expression at only 10% of RNA-Seq sequencing costs – Service or Kit
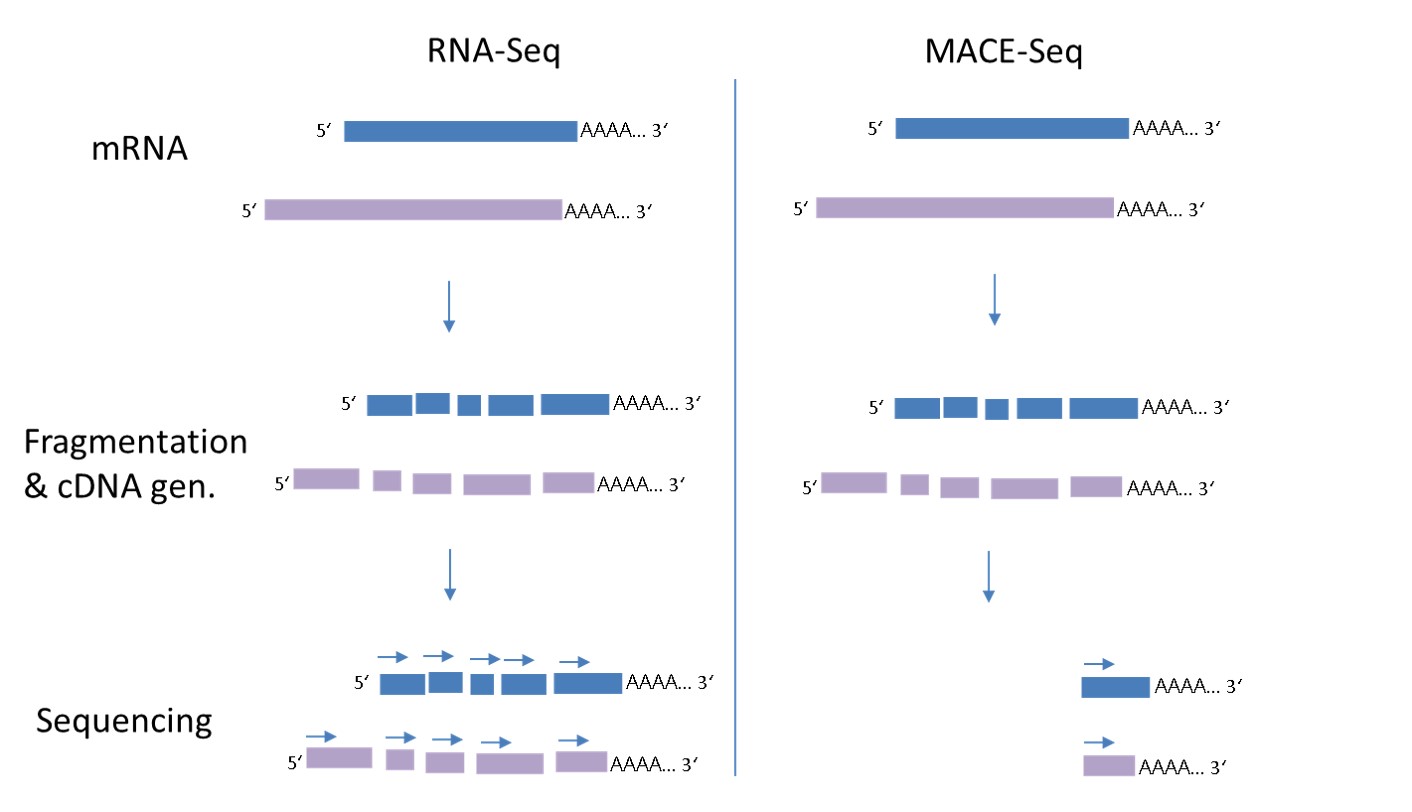
MACE-Seq reveals gene expression, allele frequencies and alternative polyadenylation of all poly-A mRNA molecules from any organism. MACE-Seq is an improved variant of “3′ single end mRNA Seq” or “Tag-Seq” where each transcript is represented by one single molecule or “tag” derived from the 3′ End of the mRNA. While in normal RNA-Seq, each transcript molecule is broken into several peaces of which every one is sequenced, with MACE-Seq only a sinlge read is needed to identify the transcript. Therefore, only about 10% of the reads are needed to generate a high-resolution transcriptome when compared to a full-length RNA-Seq.
In MACE-Seq, each molecule is barcoded with a unique sequence (“TrueQuant” -unique molecular identifiers) for PCR bias elimination (patented). Thanks to our latest improvements, the method is highly sensitive and requires only the content of a single cell of mRNA (the section “Sensitivity and reliability for low input” below will be updated soon). Our service ranges from RNA-extraction to bioinformatics. MACE-Seq is also available as a kit for your own lab.
MACE vs. full length RNA-Seq
mRNA transcripts – many in low copies, few in many copies
Many important transcripts such as transcription factors or receptors are usually transcribed in very few copies, while a handful of transcript-species e.g. of structural proteins can make up 80% of a transcriptome. Rare transcripts are usually invisible on Microarrays and with RNA-seq, they can only be detected at very deep sequencing depth at high costs.
Another problem of RNA-Seq is that longer transcripts are overrepresented and shorter transcripts underrepresented. Depending on the method, the normalisation of RNA-Seq data may lead to different sets of allegedly differentially expressed genes (e.g. Soneson & Delorenzi 2013) and
Because in MACE-seq (right side in the graph below) only one single read per transcript molecule is generated, short and rare transcripts are identified already at 10-20 times lower sequencing depth, when compared to full length RNA-Seq and no length-based normalisation is required. In comparison to other 3′ mRNA techniques, our latest MACE-Seq allows to use only sinlge-cell amounts of mRNA. In only 3,5 h up to 348 libraries can be conveniently prepared, ideal for screening assays of for example organoids, 3-d cell cultures etc.

More different transcripts and higher coverage of 3’ end for allele identification when compared to regular RNA-Seq
The figure to the left (upper part) shows the number of different transcripts identified with MACE (blue) and RNA-Seq (red) at the same sequencing depth of 20 M reads from human placenta tissue. The lower part shows the number of covered genetic loci with minimum 30x coverage. Because of the concentration on a smaller part of the transcript, the coverage is higher and alleles can be discovered more accurately. In addition, the aimed 3’ends are usually rich in polymorphisms.
FFPE-derived RNA 
As only the 3′ ends of the mRNAs are required, MACE works very well also with degraded material. Down to a RIN (RNA Integrity Number) of 3, MACE is fully functional and even at lower RIN values useful transcriptomes can be generated. Because only one tag is sequenced per transcript, differentially degraded samples can be readily compared, unlike with regular RNA-Seq as for the latter the number of generated reads per molecule is depending on the degradation status.
A peer reviewed comparsion between MACE-Seq and RNA-Seq for FFPE material was published by Boneva et al. 2020 (https://www.nature.com/articles/s41374-020-0446-z). The authors found that “…detection patterns appear to be stable over time and MACE transcriptome analysis is feasible even after 13 years of storage. Thus, 3′-MACE-RNA sequencing allows to perform transcriptomic analyses in aged, archived FFPE tissue samples, which may have been considered unsuitable for RNA sequencing in the past. “
Low Input amounts
An area of 2×2 mm of tissue from a 10 µm FFPE histological slide, 5 ng of total RNA or 5.000 cells is sufficient for the analysis of 15.000 -35.000 different transcripts.Reliability
MACE-seq requires only 0,05 ng of total RNA as input while maintaining consistent transcript quantification. As shown in the table below, the pearson correlation between MACE-seq transcription profiles from 100 ng and 1 ng of total RNA input is 0,96 and 0,87 between data from 100 ng and 0,05 ng total RNA. The lower pearson correlation in the later comparison is due to a reduced number of low-level transcripts in the 0.05 ng sample.
| total RNA | 0.05 ng | 0.1 ng | 0.5 ng | 1 ng | 5 ng | 25 ng | 100 ng |
| 0.05 ng | 1 | ||||||
| 0.1 ng | 0,830518 | 1 | |||||
| 0.5 ng | 0,881877 | 0,923032 | 1 | ||||
| 1 ng | 0,864297 | 0,896227 | 0,939137 | 1 | |||
| 5 ng | 0,864884 | 0,898313 | 0,940447 | 0,995379 | 1 | ||
| 25 ng | 0,871146 | 0,89844 | 0,943703 | 0,978482 | 0,986371 | 1 | |
| 100 ng | 0,867123 | 0,888887 | 0,936261 | 0,959999 | 0,969597 | 0,995612 | 1 |
Technical variance- replicates
the pearson correllation between three technical replicates using MACE-seq from 5 ng of total RNA is shown below. Values of >0,996 demonstrate very high technical reliability
| 5 ng – 1 | 5 ng – 2 | 5 ng – 3 | |
| 5 ng – 1 | 1 | ||
| 5 ng – 2 | 0,996987 | 1 | |
| 5 ng – 3 | 0,996446 | 0,99798 | 1 |
Workflow for FFPE-Transcriptomics using MACE-Seq
![]()
MACE-Seq for FFPE vs. Exome Capture RNA-Seq
In a study by Zong et al. 2023, different exome capture RNA-Seq protocols were compared. Several differences to MACE-Seq are apparent: Although a sequencing depth of 30 M reads with 2×150 or 2×100 bp long reads was used for exome capture RNA-Seq the number of detected genes was lower than the number transcripts identifid for example by Boneva et al. 2020, who have used MACE-Seq for FFPE-derived RNA with only around 5 M reads. Another improtant difference is that for MACE-Seq, between 0.1 and 10 ng of total RNA are sufficient, while Exome Capture RNA-Seq requires 100 ng.
MACE vs. Other 3′ mRNA-Seq Methods – patented UMIs, no hexamers
MACE was developed in 2007 when we patented the “TrueQuant” Method (Unique Molecule Identifiers, UMIs). The MACE technology therefore has included the TrueQuant barcodes, individually barcoding each molecule prior to the PCR steps. The individual barcodes allow identification of PCR copies and sequencing errors and are a pivotal element of our techniques. This is an important difference to other 3′ end sequencing techniques without this error correction possibility. Licensing for the use of UMIs without our kits can be requested here. In addition to the UMIs, MACE does not use random hexamers for the cDNA production to avoid the introduction of bias (see Hansen et al. 2010).
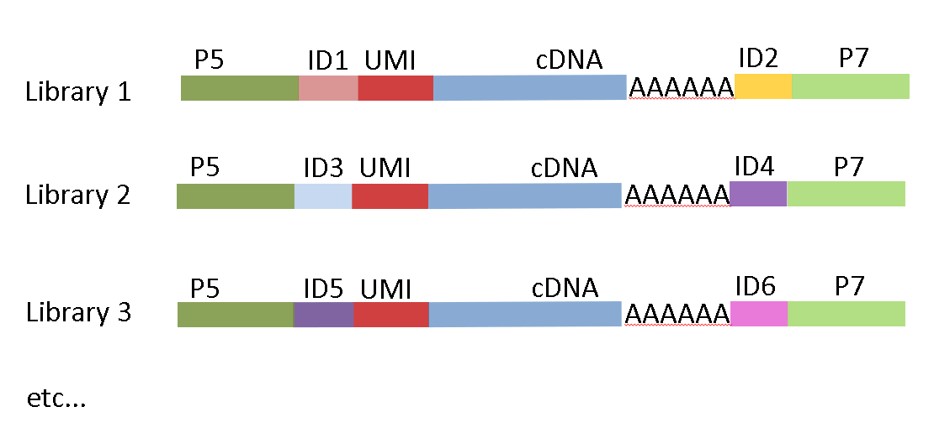
MACE-Seq construct with Unique Dual Indices (UDI)
In our latest version, we implemented unique-dual-indexing to avoid sample-misassignment due to “index-hopping” during the illumina sequencing.
Our kit uses UMIs and UDIs in its standard version and optional highly standardized and peer-reviewed published Bioinformatics.
Why “Number of Reads” Does Not Equal “Sequencing Depth”
In MACE, we use our TrueQuant molecular barcoding technique to eliminate PCR introduced bias. In a regular RNA-Seq experiment, the quality of the data is often thought to be related to the numbers of sequenced reads. However, during PCR steps of the sample preparation procedure, the original template molecules are amplified. While only the template molecules carry the information, the PCR products are simply copies of them do not contribute to the information-content of the sample. It is pivotal to identify these “PCR copies” and eliminate them, as they can introduce a bias into the data. At the same time, only those “copies” can be kept that have the best read quality, which strongly improves the data quality in general. The best currency for RNA-Seq quality is therefore the number of unique reads in the sample, not the number of reads. With TrueQuant, we can eliminate PCR copies and therefore strongly improve the results.
Low Input – sensitivity, single cell analyses
The latest version of MACE-Seq requires only 0,01 ng or 10 pg which equals the amount of total RNA that is found in a single cell.
MACE for breeding research: TranSNiPtomics
Reduced complexity: concentration on the highly polymorphic 3′ Ends for gene-based marker and allele identification.
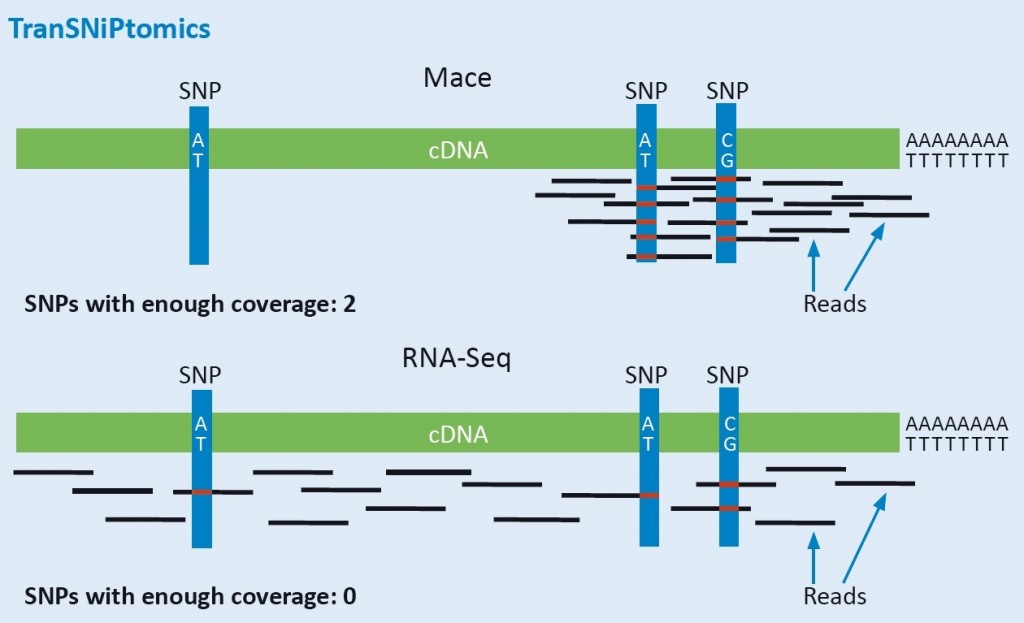
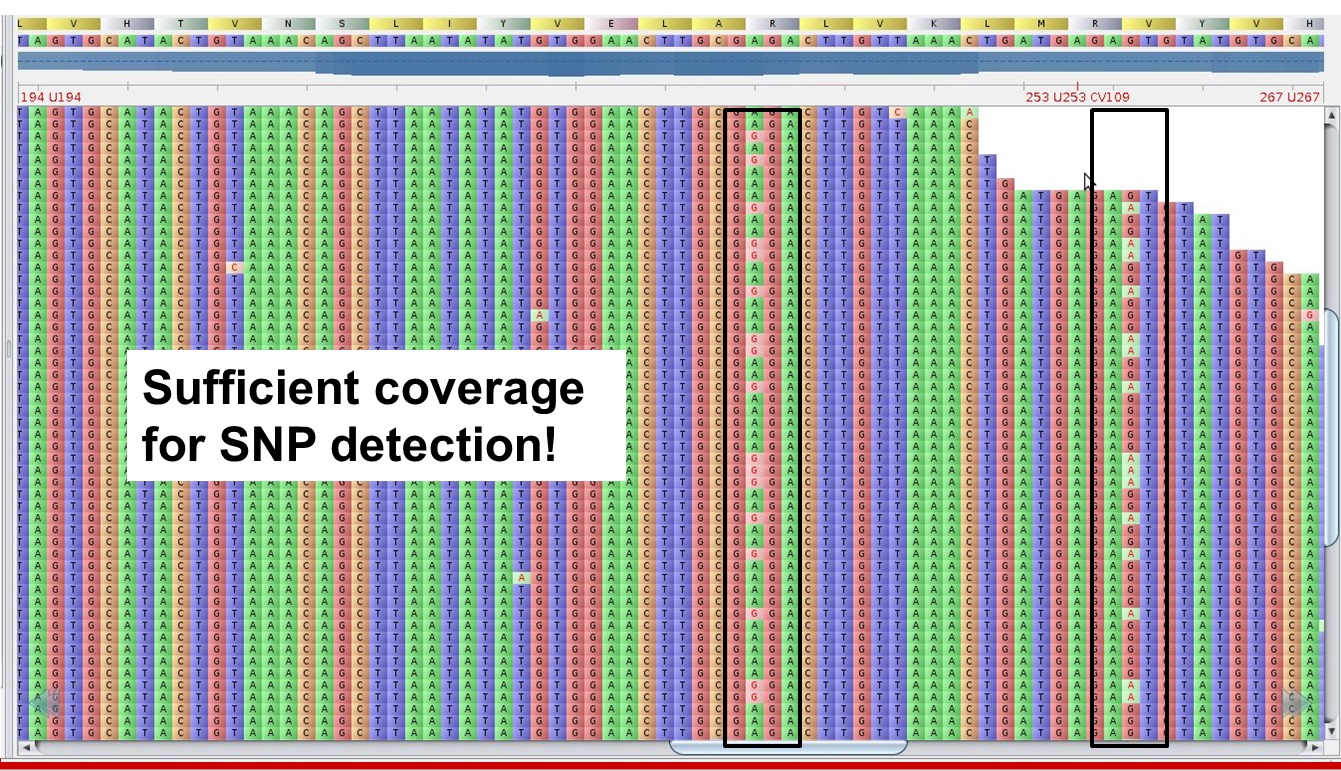
MACE reduces the sequencing to the SNP-rich 3‘ ends (UTRs) of the transcript. This ensures high coverage of this polymorphic region, even of low-level expressed transcripts. Therefore, SNPs and other variants can be reliably detected by MACE, simultaneously with the exact measurement of gene expression levels. Because of the much lower costs when compared to RNA-Seq, MACE is the ideal platform for simultaneous genotyping and gene expression analysis. All identified polymorphism (alleles) are highly valuable molecular markers, because they are located within the gene, and not, as with most other GBS-techniques, randomly distributed throughout the genome. MACE- derived markers or alleles are therefore highly coupled to traits. Thanks to parallelization of our processes, we can analyze hundreds of samples simultaneously. MACE is therefore also increasingly used for genotyping purposes.
Example:
MACE, 20 M reads: Alleles are clearly distinguishable
Below: RNA-Seq, 20 M reads: The different alleles cannot be identified securely!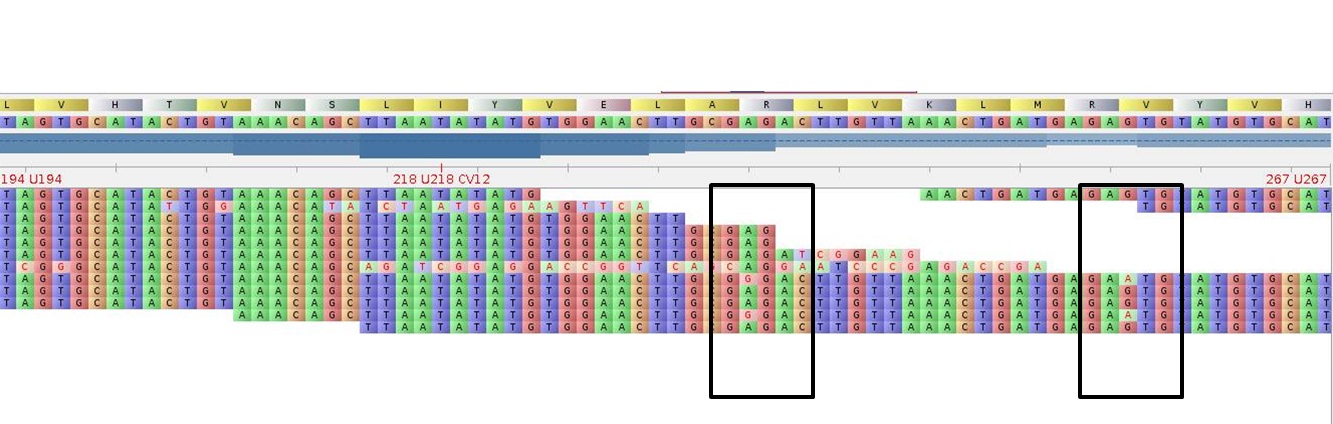
Allele Specific Expression (ASE)
Thanks to the high coverage of the sequenced region and the allele-specificity of the 3’ Ends, MACE is also ideally suited for the analyses of Allele Specific Expression (ASE).
Alternative Polyadenylation (APA)
Because the MACE-tags (reads) can be generated in a way such that most of them contain a part of the poly-A tail, Alternative Poly-Adenylation (APA) can be monitored very accurately (for example Tushev et al 2018). Because APA can prevent the transcript to interact with miRNAs (see e.g. Mayr & Bartel, 2009), APA leads for example to increased stability of transcripts e.g. of oncogenes, it also can lead to truncated transcripts including tumor supressor genes as observed 2018 in leukaemia. Hence, the analysis of APA is pivotal for understanding gene activity and certain disease mechnanisms, especially in combination with miRNA research. MACE-Seq was used to generate a comprehensive database for APA in different organisms (APADB).
Depletion of highly abundant transcripts e.g. globin
for transcriptomes with highly abundant transcript species such as globin in whole blood transcriptomes we efficiently deplete these transcripts prior to the sequencing library generation in order to increase the proportion of the remaining transcripts.
Because MACE data has some special characteristics, we include the bioinformatics analysis both for the service and the kit. Therefore, you do not need to set up your own bioinformatics and can profit from our constantly improved and widely used bioinformatics pipeline. Besides the raw-data, you receive ready-to-use results tables containing NCBI or ENSEMBL IDs and descriptions, expression values, p-values for differential expression, Fold Changes, SNPs, etc., which can conveniently be analyzed e.g. with other bioinformatics analysis tools or Excel. In addition, we provide Gene Ontology (GO) Enrichment Analyses and plots and graphs which can be easily accessed and browsed using our Web-Interface (https://tools.genxpro.net). Data is provided via sftp or can be shipped on a hard-disk. Please feel free to download a MACE dataset from human huvec cells: MACE Example_human_huvec_cells More information about the table content can be found here: MACE results table: ‘all_comparisons_merged’ Ship us the tissue or RNA, we make the rest ! Simply provide >100 ng of DNA-free RNA or enough raw material to obtain an equivalent amount. We will perform the entire analysis and provide result tables, SNPs, GO enrichment analyses, provide the best candidates for markers and perform other analyses if requested. Please use our sample shipping form when sending samples and have a look at our “getting started with genxpro” document. Tushev G, Glock C, Heumüller M, Biever A, Jovanovic M, Schuman EM.Alternative 3′ UTRs Modify the Localization, Regulatory Potential, Stability, and Plasticity of mRNAs in Neuronal Compartments.Neuron. 2018 May 2;98(3):495-511 Tosches MA, Yamawaki TM, Naumann RK, Jacobi AA, Tushev G, Laurent G. Evolution of pallium, hippocampus, and cortical cell types revealed by single-cell transcriptomics in reptiles. Science. 2018 May 25;360(6391):881-888. Agarwal R, Cao Y, Hoffmeier K, Krezdorn N, Jost L, Meisel AR, Jüngling R, Dituri F, Mancarella S, Rotter B, Winter P, Giannelli G.Precision medicine for hepatocelluar carcinoma using molecular pattern diagnostics: results from a preclinical pilot study. Cell Death Dis. 2017 Jun 8;8(6):e2867. Hofer TP, Zawada AM, Frankenberger M, Skokann K, Satzl AA, Gesierich W, Nold-Petry CA, Lo CY, Rudloff I, Elgass KD, Li S, Gantier MP, Lotz-Havla AS, Gersting SW, Cho SX, Lao JC, Ellisdon AM, Rotter B, Azam T, Mangan NE, Rossello FJ, Whisstock JC, Bufler P, Garlanda C, Mantovani A, Dinarello CA, Nold MF. IL-37 requires the receptors IL-18Ra and IL-1R8 (SIGIRR) to carry out its multifaceted anti-inflammatory program upon innate signal transduction.Nat Immunol. 2015 Mar 2 Zawada AM, Rogacev KS, Müller S, Rotter B, Winter P, Fliser D, Heine GH. Massive Analysis of cDNA Ends (MACE) and miRNA expression profiling identifies proatherogenic pathways in chronic kidney disease MACE and miRNA profiling in CKD.Epigenetics. 2013 Nov 1;9(1) Please have a look at numerous publications about MACE and our other techniques and services here. For testimonials please click here.
Bioinformatics
Example data
Requirements
Some references and testimonials
Schuberth M, Levin J, Danek A, Rotter B, Heine GH, Ziegler-Heitbrock L. slan-defined subsets of CD16-positive monocytes:Characterization of subsets of the CD16-positive monocytes: impact of granulomatous inflammation and M-CSF-receptor mutation. Blood. 2015 Oct 6. pii: blood-2015-06-651331.For orders or quotation requests, please use our web-tool
From tissue to results- full service or kits for all your samples
